Terps Racing Electric Vehicle (TREV)
As part of the aerodynamics and composites team at Terps Racing Electric Vehicle I am the lead designer for the rear wing and side pods for our upcoming car: TREV 4. This page will showcase my design, simulation, manufacturing, and testing process.
Rear Wing
The rear wing contributes downforce at the rear of the car. This allows the aerodynamic center to be behind the center of gravity which gives far better control. More importantly the rear wing is what pushes down onto the rear tires when cornering allows for greater entry and exit speeds which leads way to a faster car.
Design
As the lead designer for the rear wing for our next FSAE race car: TREV 4, my goal was to improve upon the existing design for more downforce and less drag. This section will showcase the design of the rear wing and its subsidiary components: endplates, major airfoil, minor airfoils as well as the drag reduction system (DRS) and mounting system.
Isometric View of Rear Wing
The isometric view of my latest rear wing shows the different components as well as where they are placed. This design is nearly finalized with only mounting to be fixed. In later sections, the benefits of what this rear wing brings compared to previous iterations as well as the one ran in the previous car.
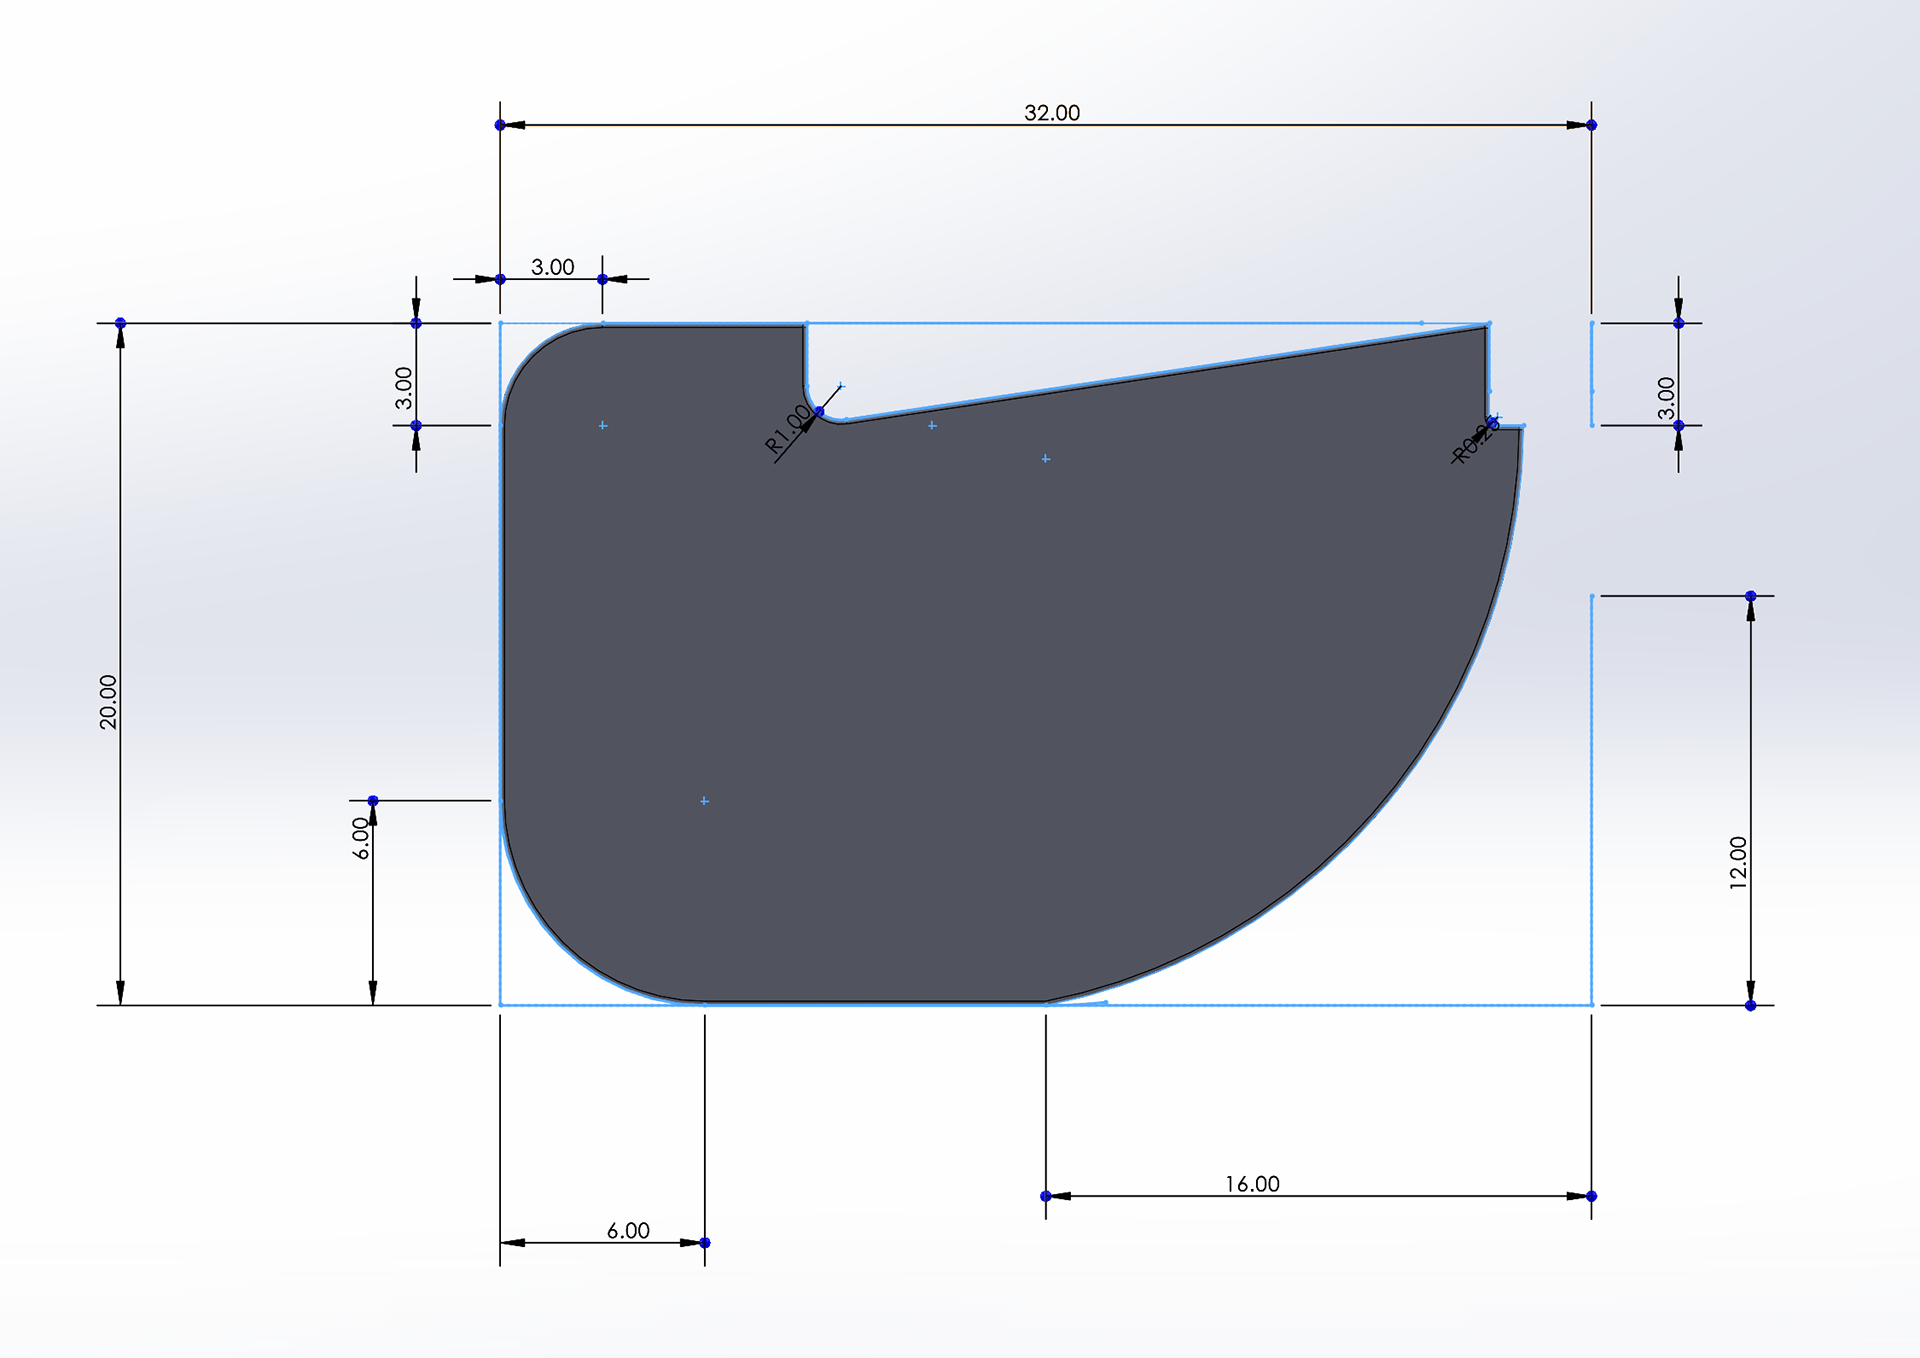
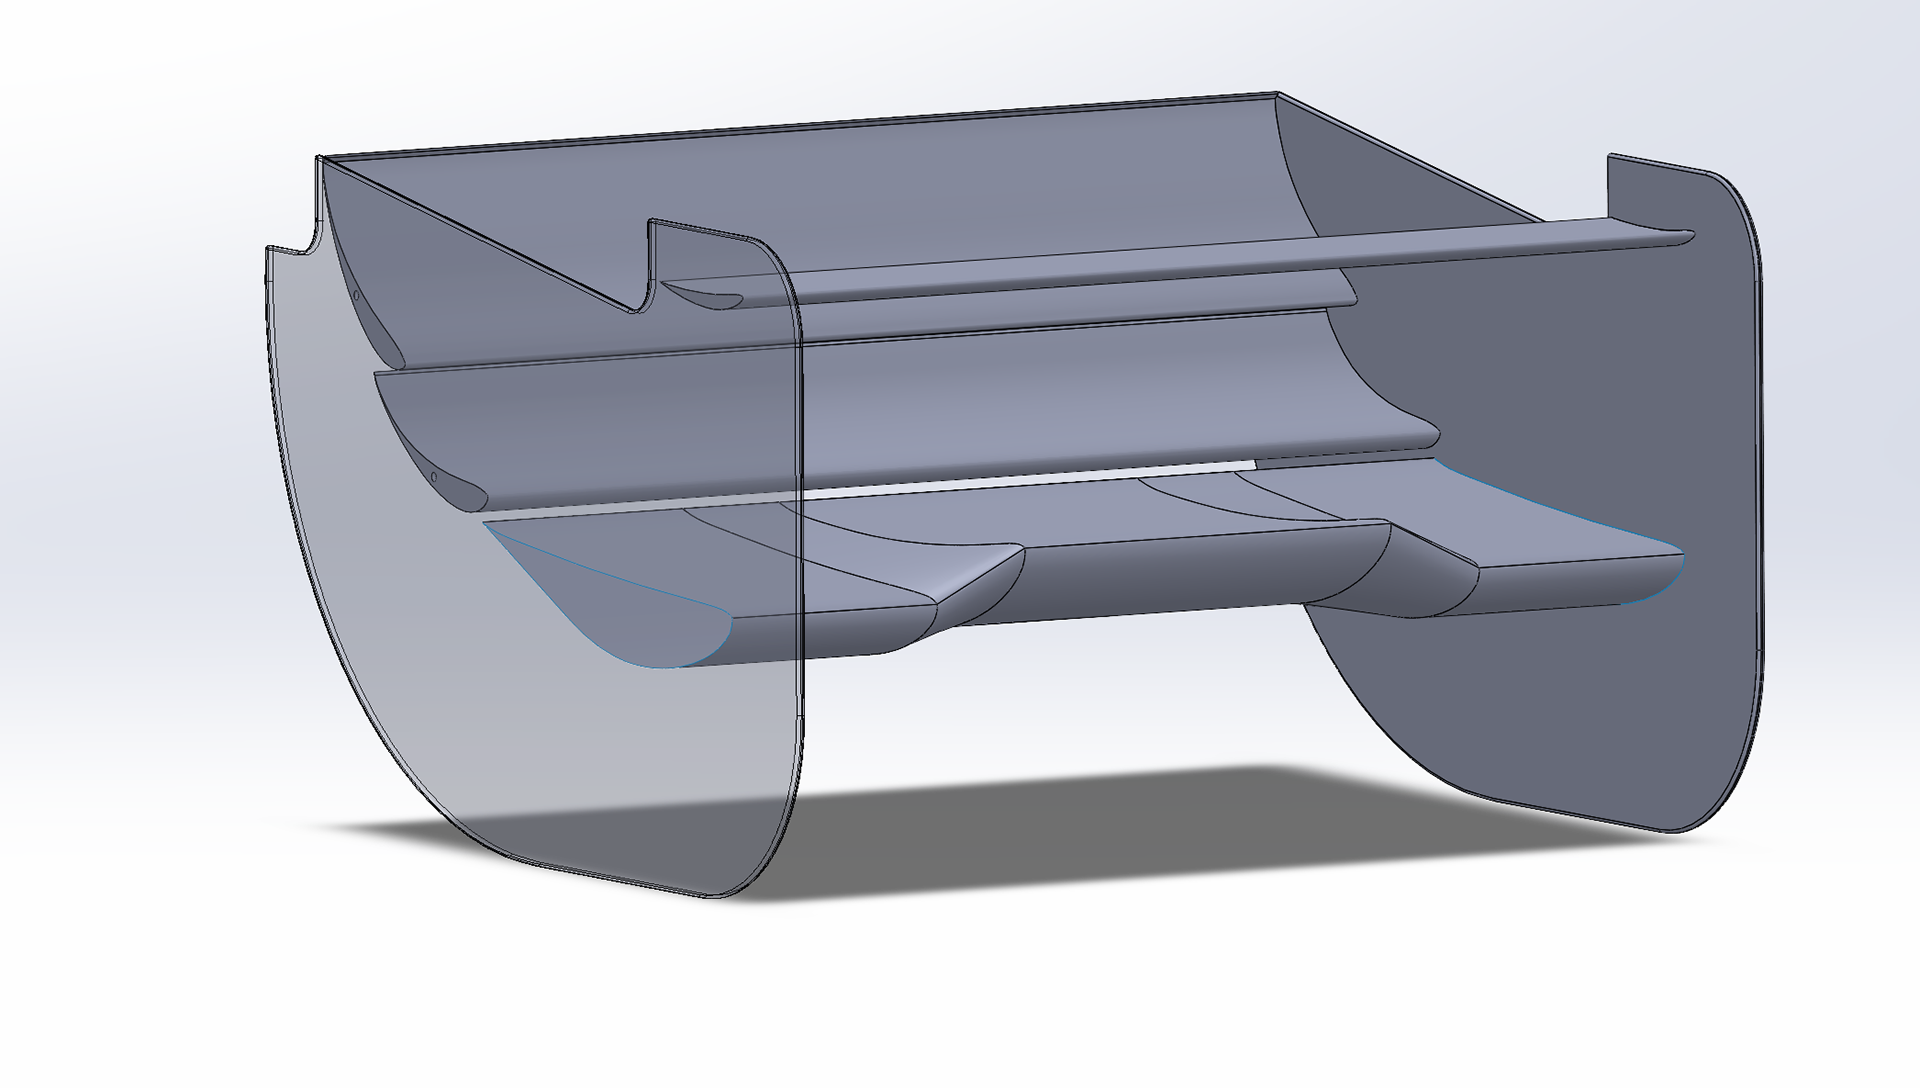
Side View of Rear Wing Endplate
The endplate of a rear wing sections off air passing the airfoils and the outside airflow. Starting with the left side as the front, the rounded edges are to decrease drag. The top cutout is a vortex generator designed to pull the slower moving air from the top side of the airfoils. This single section was one of the biggest improvements of reducing drag. Finally the right most cutout serves a similar purpose for the air traveling underneath the airfoils.
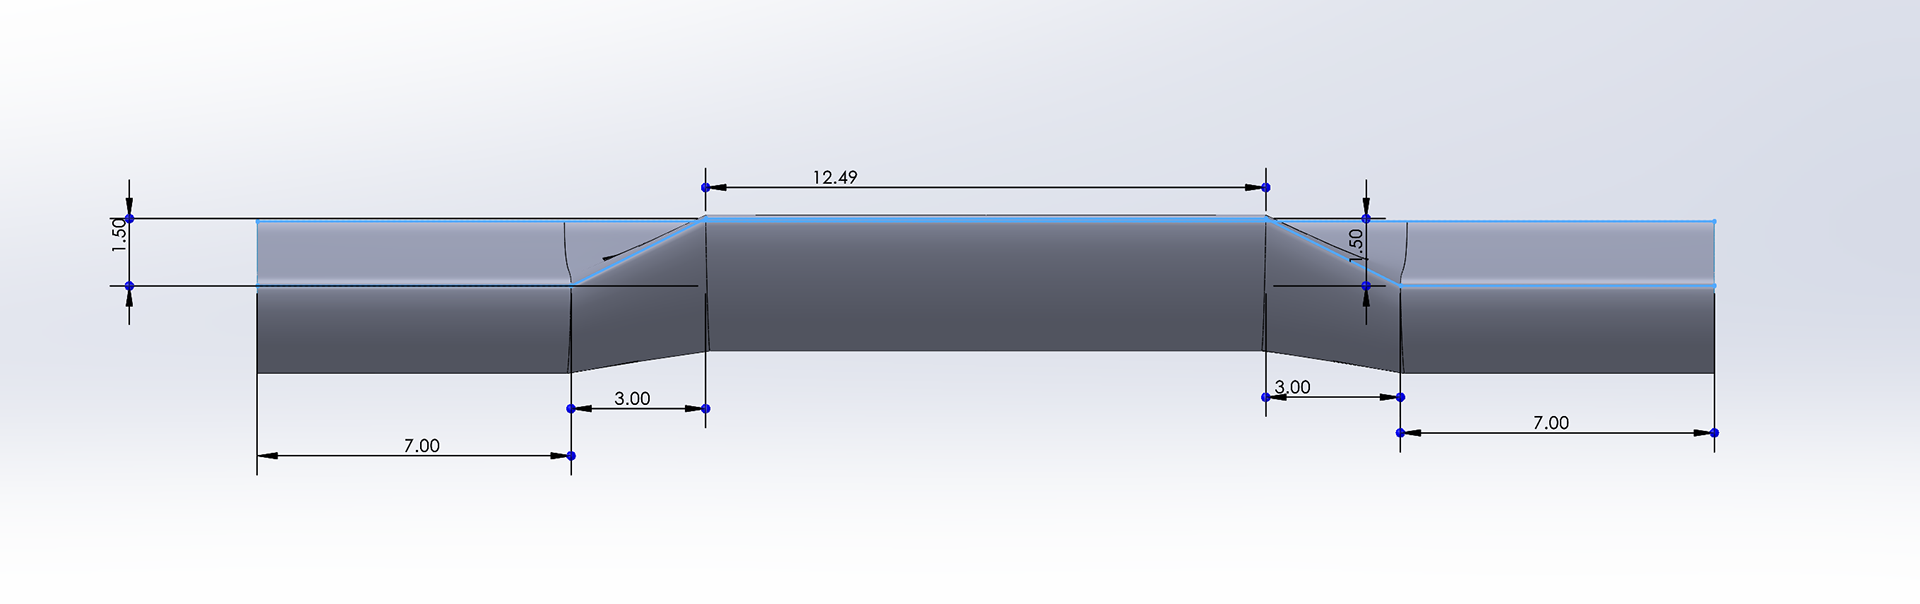
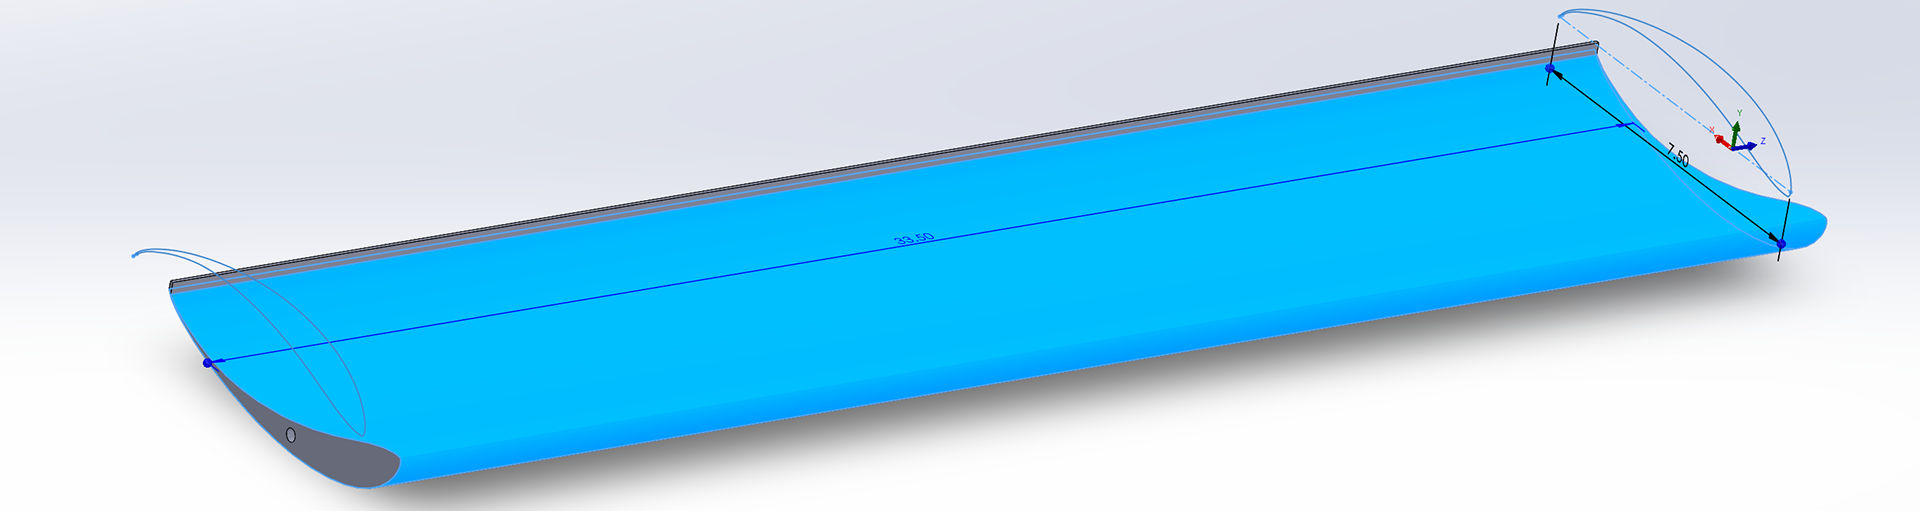
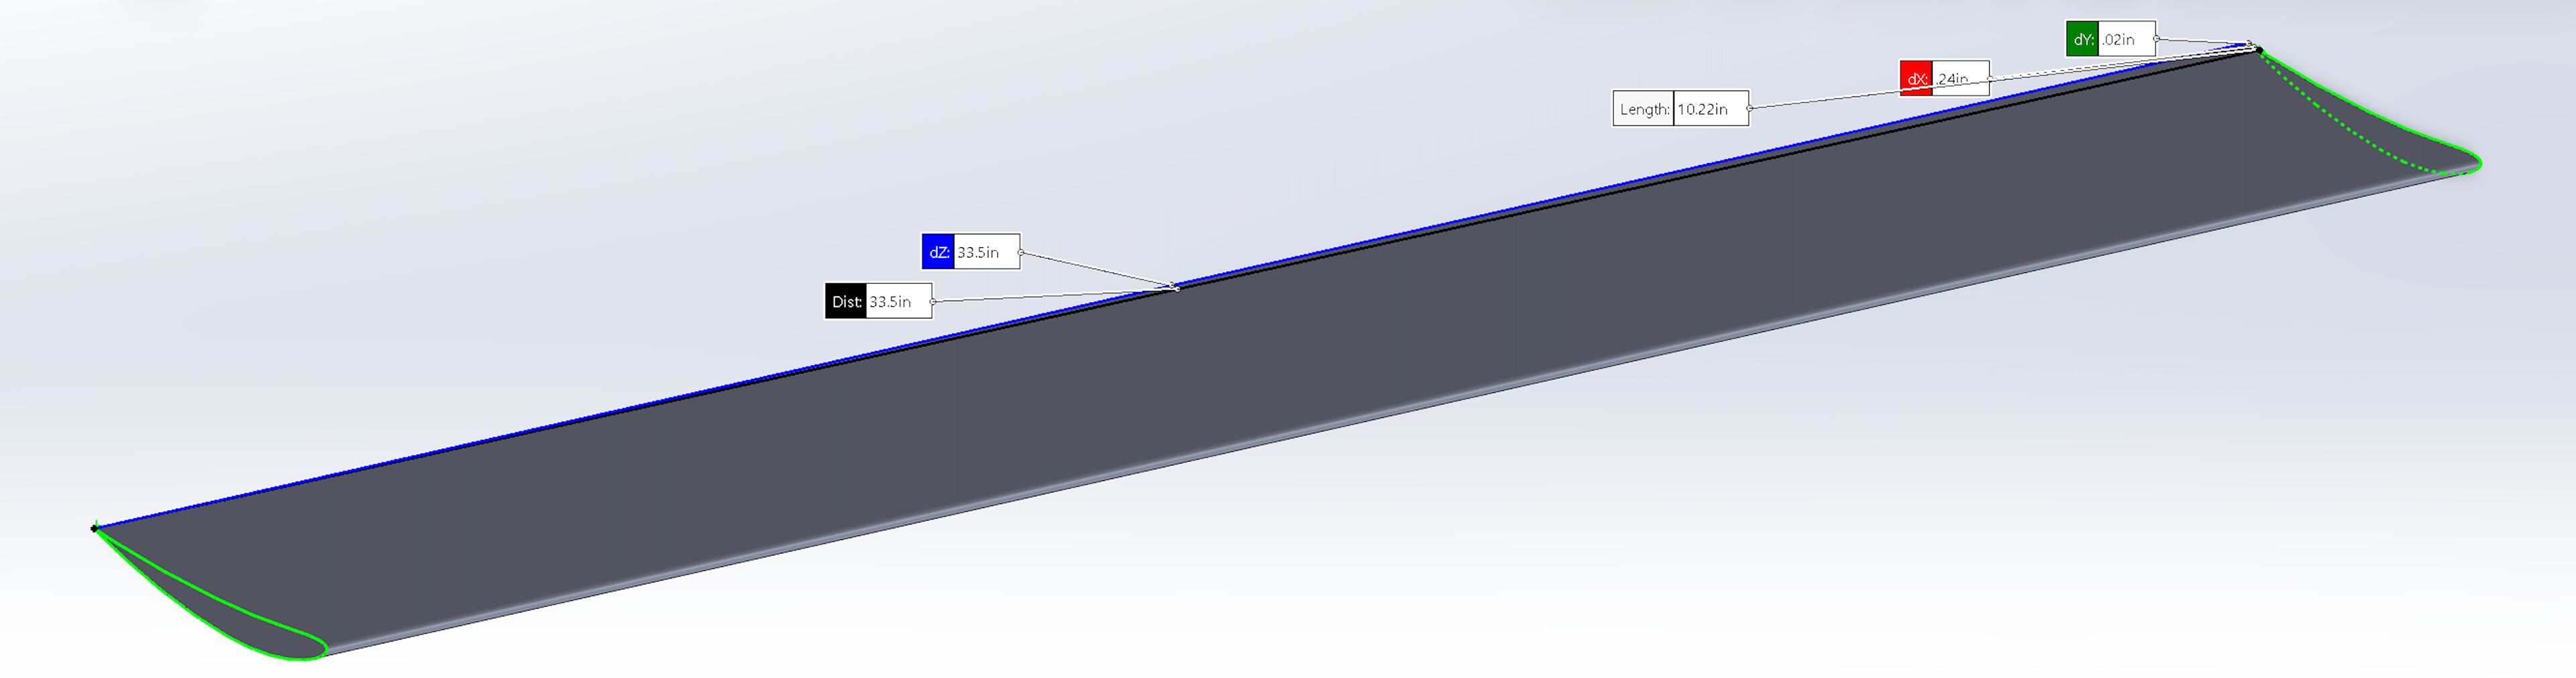
Front View of Custom Major Airfoil
The major airfoil for the rear wing is a custom profile designed around the roll hoop and brace directly in front. A main issue with oncoming airflow to the rear wing is that the bottom section is often blocked by the driver's helmet. To solve this I designed a 3D sketch to lift up the front section of the airfoil to peek above the headrest. Doing so lead to a 8% gain in downforce alone.
Isometric View of Motorsport High Downforce (MSHD) Airfoil
Isometric View of NACA 6412 Airfoil
The minor airfoils of the rear wing consist of two MSHD airfoils and one NACA 6412 airfoil. A majority of the downforce increase compared to the previous year's rear wing was using the MSHD airfoil as well as increasing the chord length. The MSHD airfoils are also set at a higher angle of attack which does increase drag, however the downforce benefit is much higher. The NACA 6412 airfoil is simply to keep the oncoming airflow at the top of the rear wing as laminar as possible, which as yield quite positive results. The exact downforce gain is shown in the simulations section.
Drag Reduction System (DRS) Demonstration
This video demonstrates how DRS will work on the rear wing. The main advantage is a 40% reduced drag coefficient with the rear two minors being at a near zero angle of attack. The four linkage system connects to the center of pressure of both the MSHD airfoils for the least amount of resistance for rotation. The DRS will be powered by a stepper motor which still needs to be finalized by the electrical subteam.
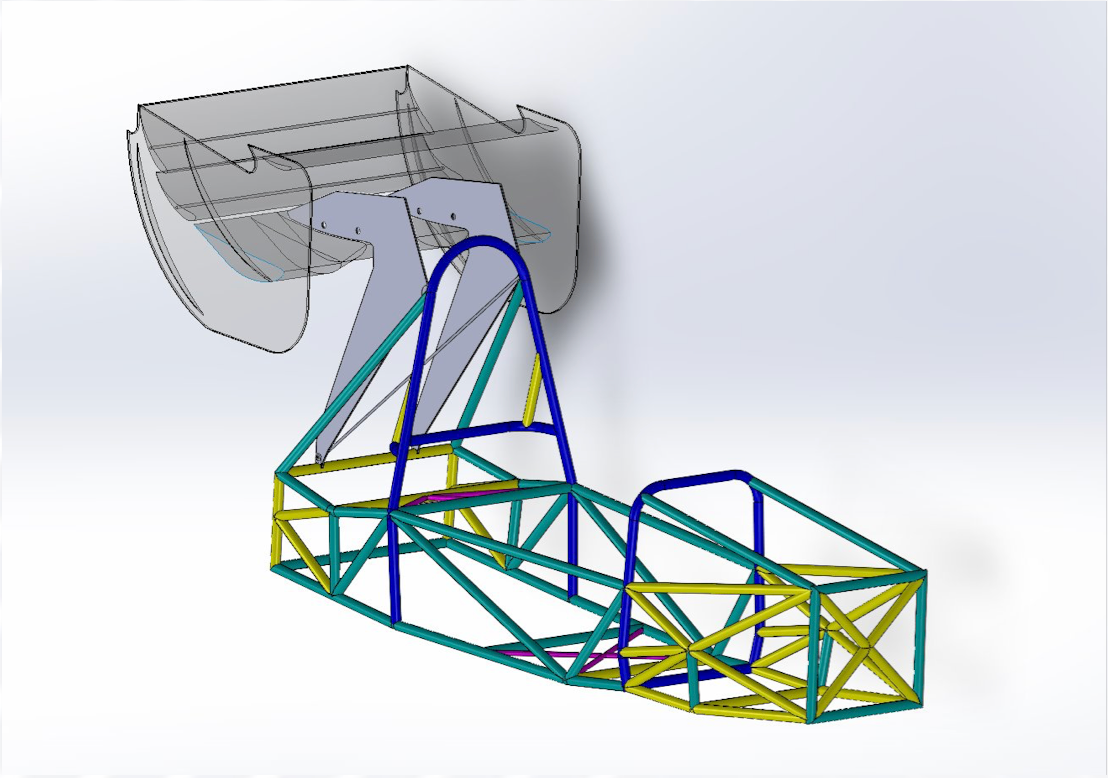
Isometric View of Swan Neck Truss Mounting
The swan neck truss mount is my current design for mounting the rear wing to its optimal position on the car. The truss needs to be optimized further, however this gives a fairly good look into what the final mounting system will look like. The swan neck was chosen as it allows for the most amount of oncoming airflow while being rigid enough to support the amount of downforce and drag generated. Additionally, there will be two rod-ends attached from each endplate to the main chassis to prevent torsion.
Simulations
The simulations ran in Siemens Star CCM+ allows for me to see how the rear wing affects the surrounding airflow. Looking through velocity plots, pressure plots, and stream lines gives additional data to design a more effective rear wing.
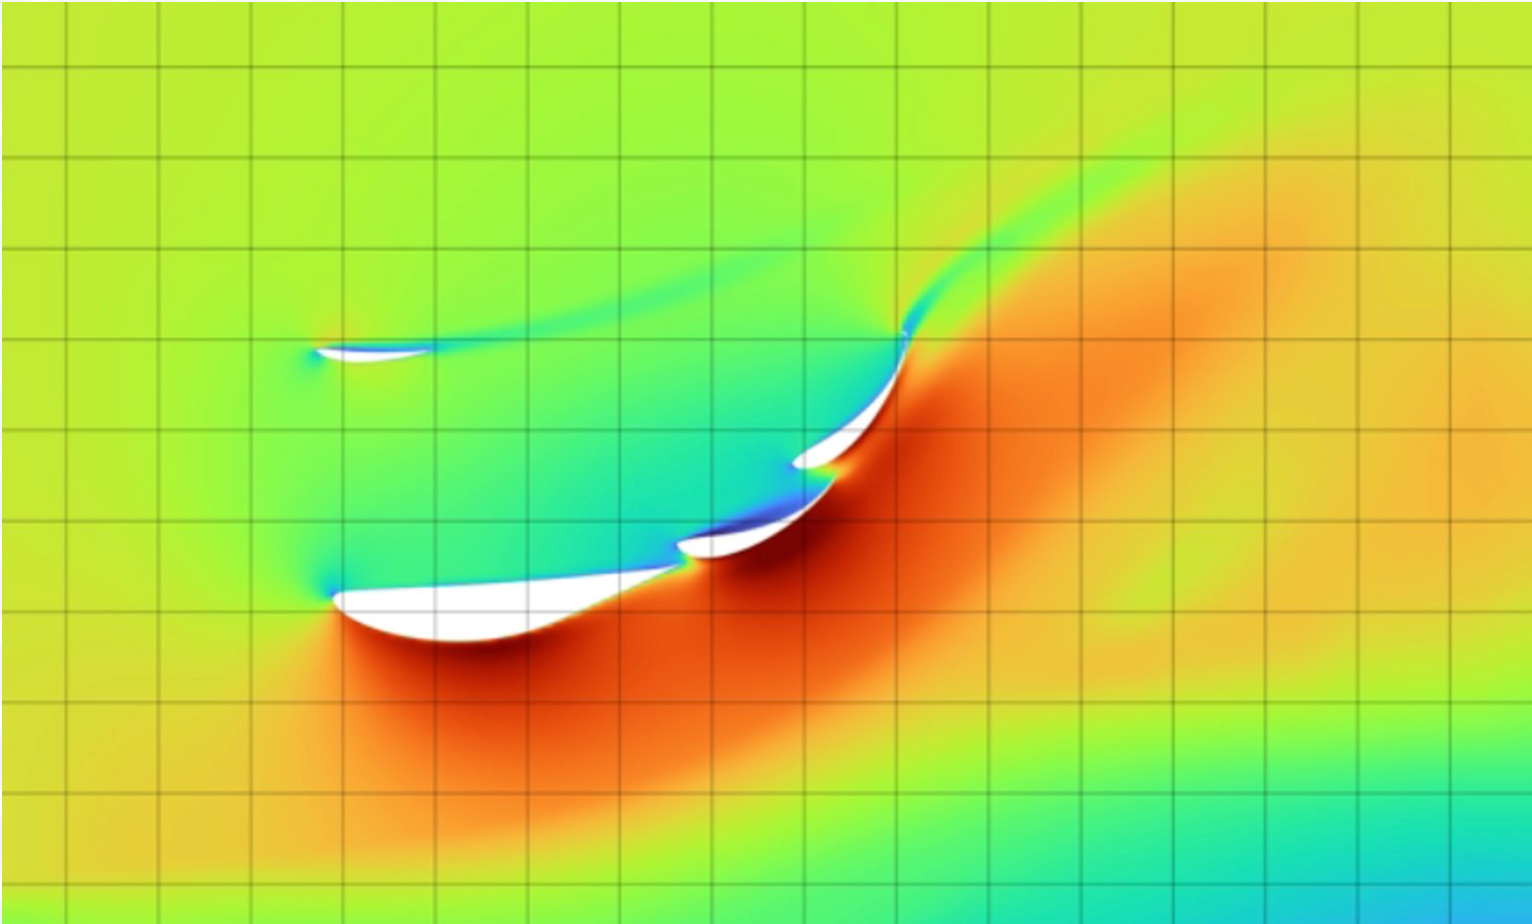
Rear Wing Y Axis Velocity Plot
The rear wing velocity plot along the y axis shows how the airfoils are configured. The NACA 6412 airfoil is keeping the region on the top of the airfoils at a much faster velocity than before. Additionally, due to the high camber of the MSHD airfoils we can se a stark velocity gradient between the upper and lower surfaces that even extends much higher and longer than the rear wing itself.
Rear Wing Y Axis Pressure Plot
The rear wing pressure plot along the y axis shows the tight band of high pressure the three element airfoils create. The bottom pressure gradient is caused by the body panels and under tray. The high pressure areas are concentrated to the MHSD airfoils. The spike at the very top of the last MSHD airfoil is due to the gurney flap.
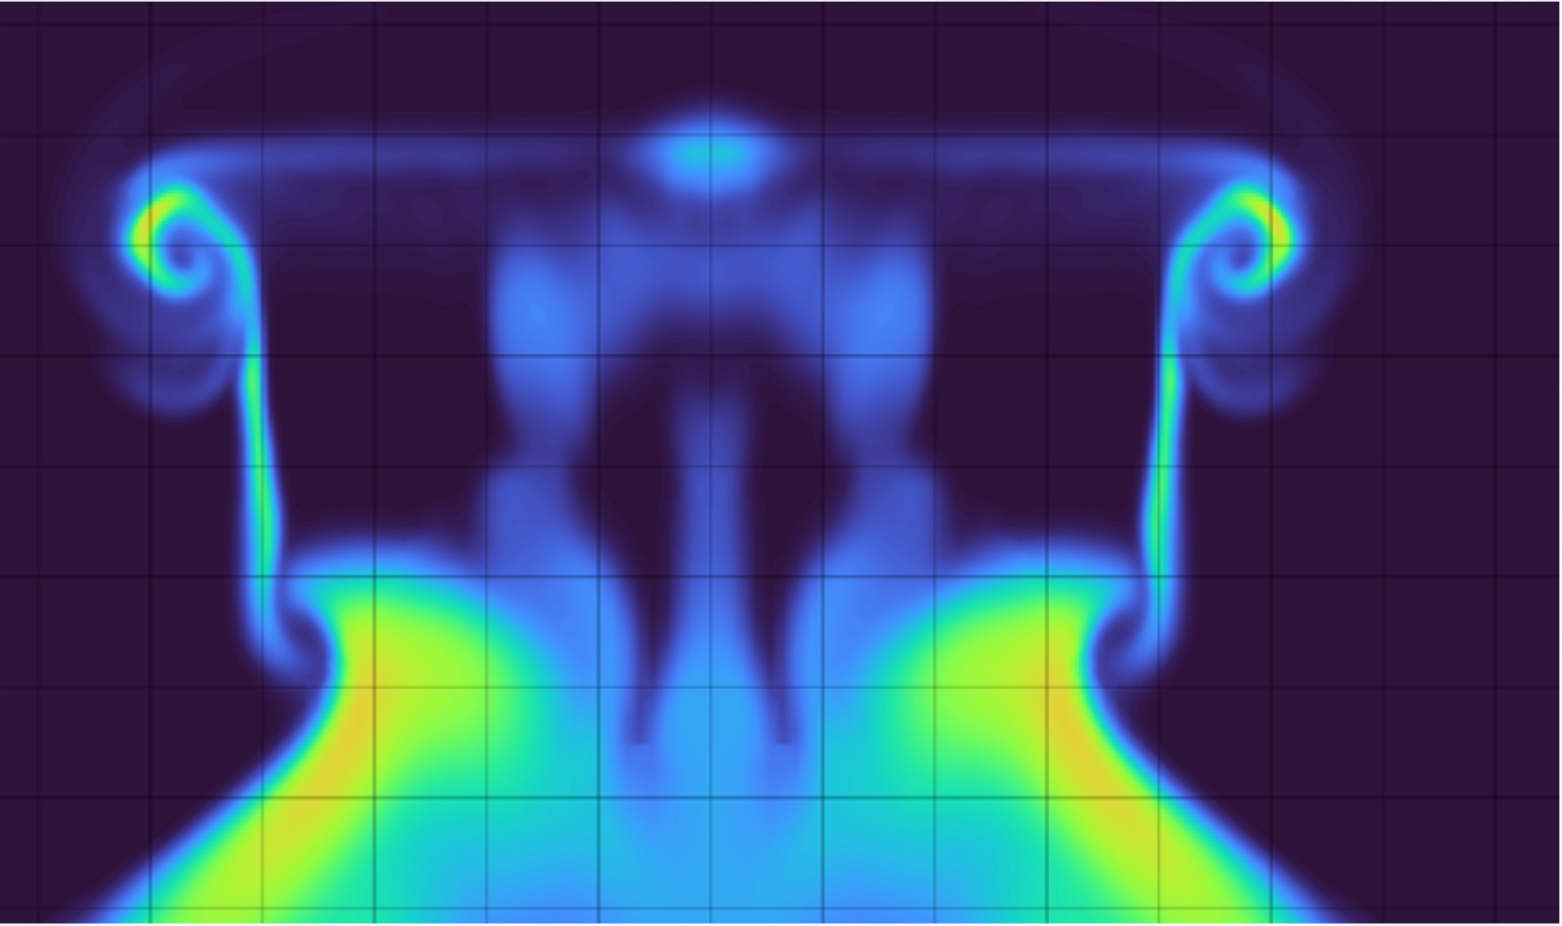
Rear Wing X Axis Velocity Plot
The rear wing velocity plot along the x axis shows the vortices generated by the top of the endplates. This slice was taken in the middle of the endplate, which is why the rear two vortices are not shown. The tight grouping of the two vortices helps define the lack of stagnation on the top surface of the airfoils.
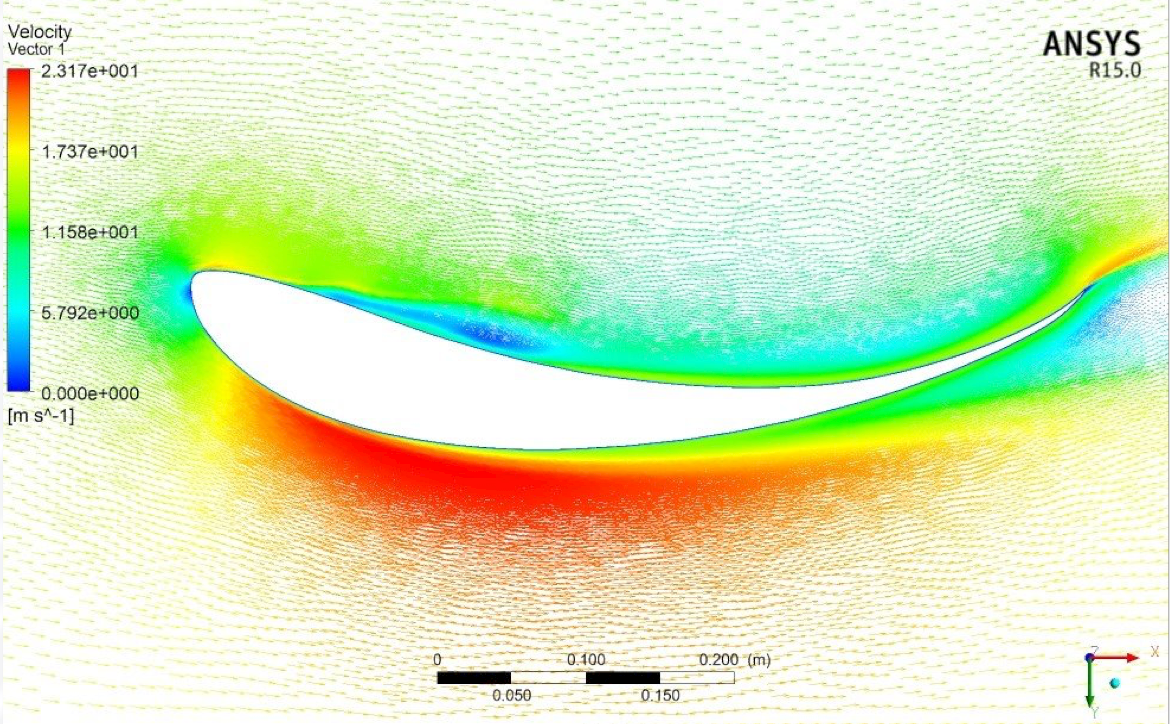
Velocity Gradient of Motorsport High Downforce (MSHD) Airfoil
This is a velocity gradient of the MSHD airfoil which shows the aggressive camber that this airfoil has. The velocity plot also shows a stagnation point occurring almost at the top side of the airfoil. What was discovered by this was that there was a set chord length and angle of attack that the MSHD would be effective at.
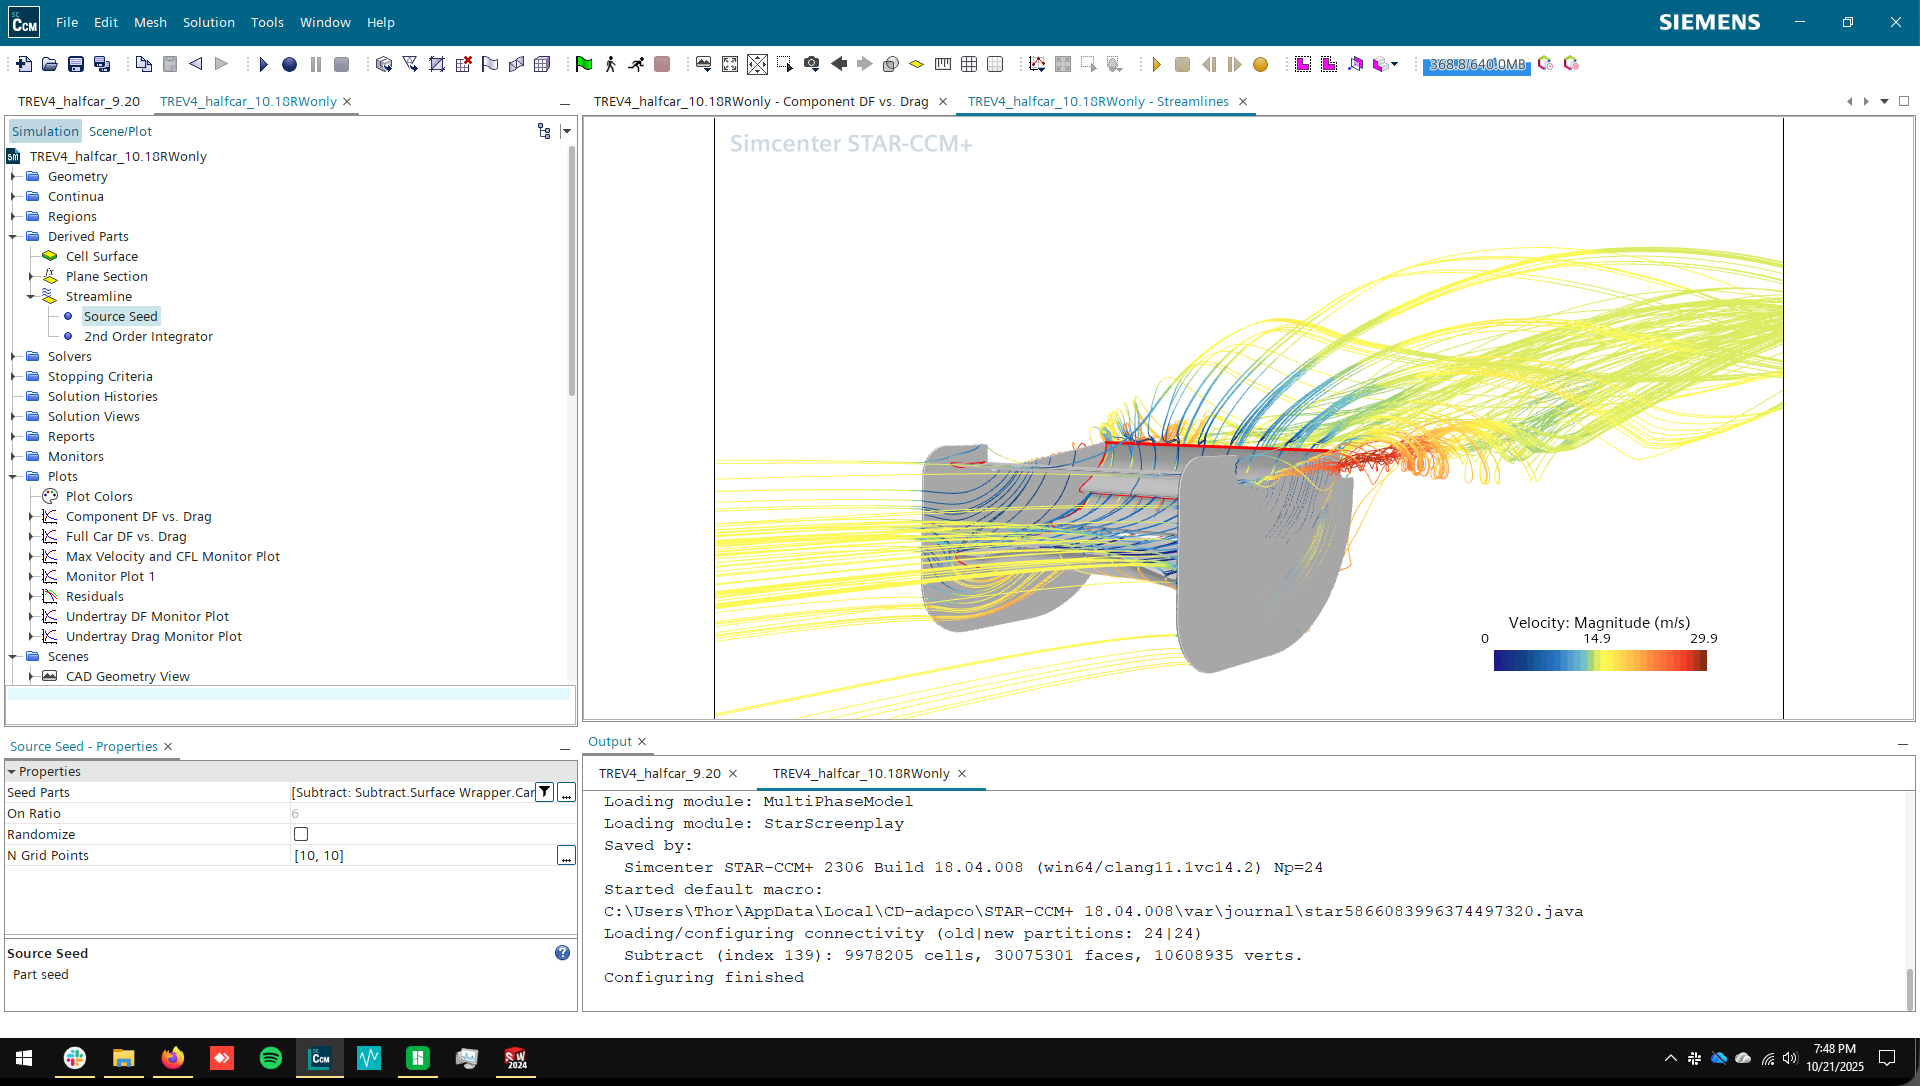
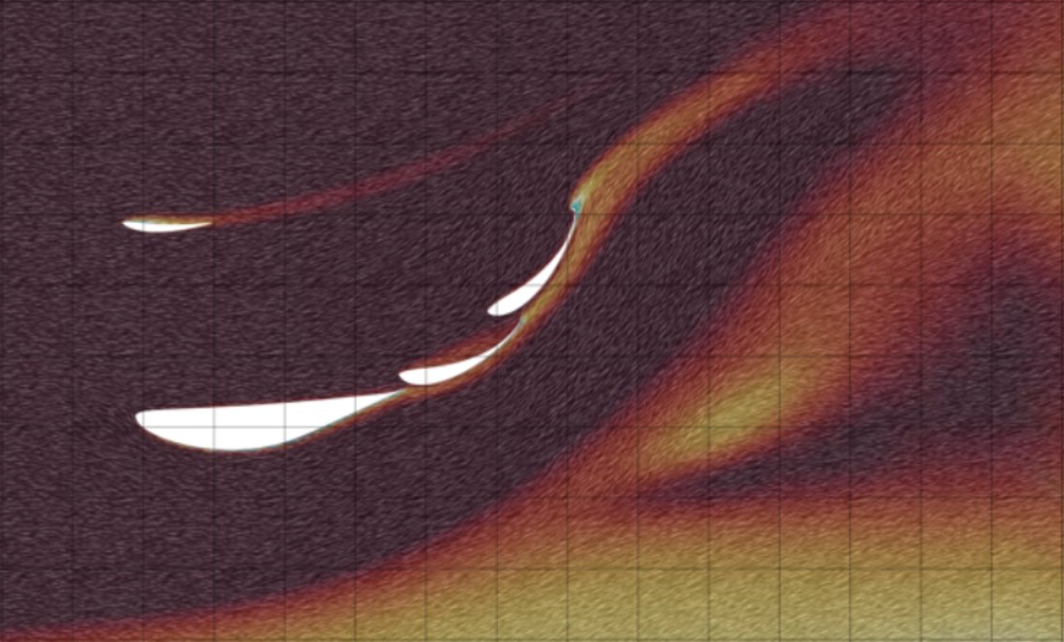
Isometric View of Rear Wing Stream Lines
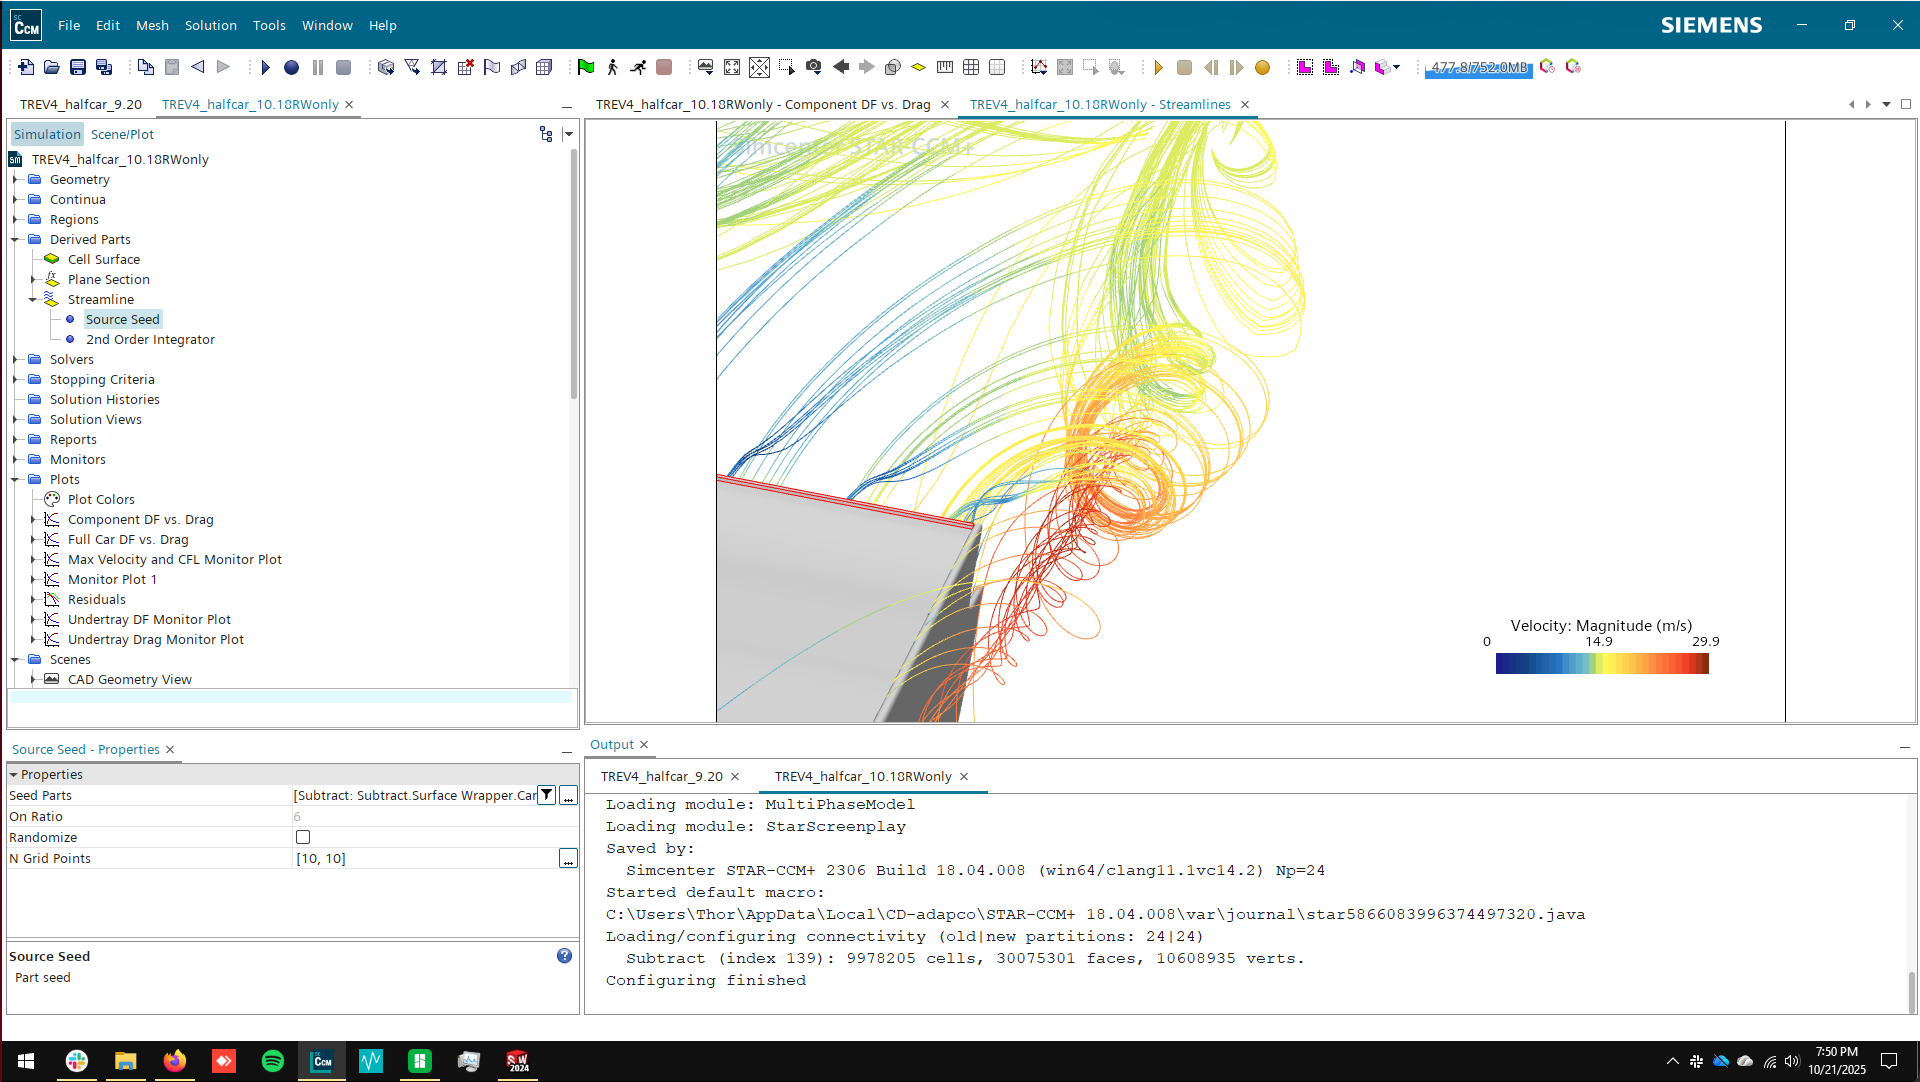
Rear Wing Stream Line Zoomed on Vortex
These two streamlines images from Siemens Star CCM+ shows how all the previously defined components come together and create a high downforce environment. The second image in particular shows how fast the vortex is spiraling outwards, which pulls in more air from the top seen on the first image in blue. The first image also gives a great look into how the flow gets kicked up due to the high angles of attack that the MSHD airfoils are set in.
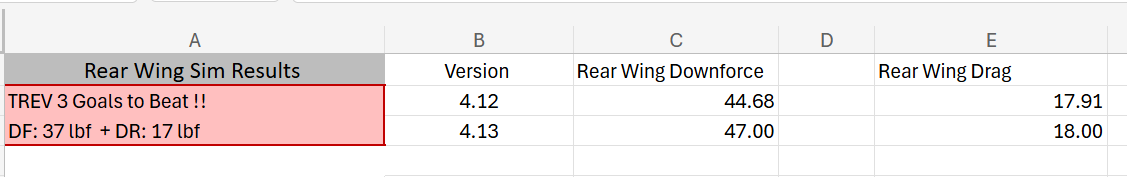
Rear Wing Simulation Results
Lastly, from the fluid simulation done on the rear wing we can see the improvements in downforce the current rear wing has over the previous year. A 27% increase in downforce with only a 5% increase in drag allows for a lift to drag ratio of 2.61 compared to 2.17. In other words, this rear wing with the modified major, MSHD airfoils, and reworked vortex generators is much more efficient compared to last year's model.
Testing
Testing allows me to validate previously defined numbers such as from the Siemens Star CCM+ fluid simulations.
Scaled Model Rear Wing Wind Tunnel Demonstration
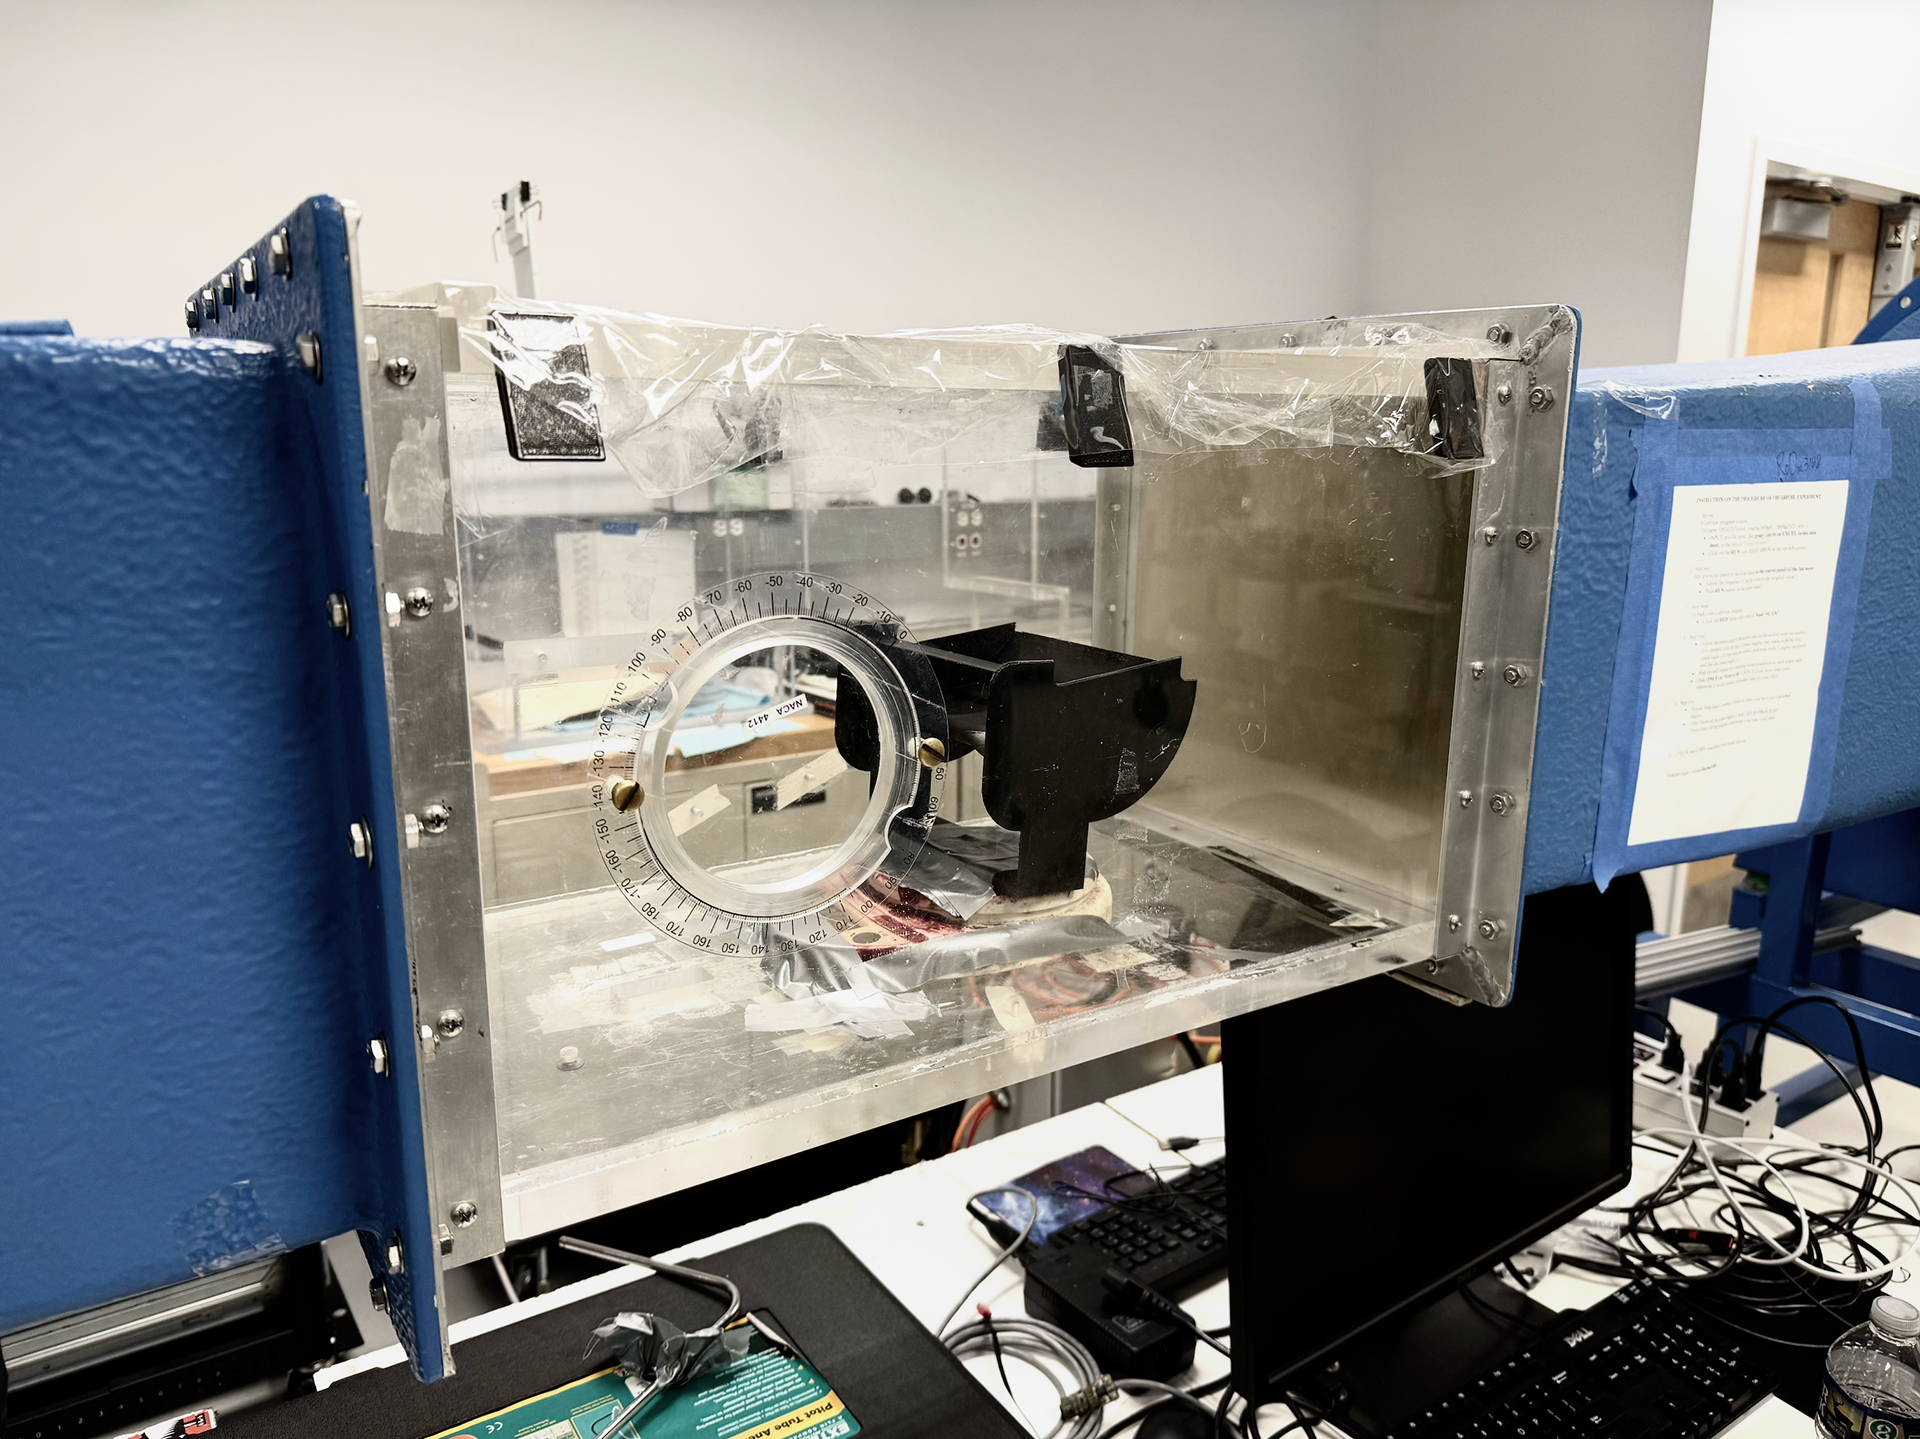
Scaled Model Rear Wing in Wind Tunnel
In order to validate our simulation results presented above, I 3D printed a scaled version of the rear wing to test inside Dr.Liu's wind tunnel. The experiment gave us .33 lbf (150 grams) of downforce at 20 mph. As I ran the simulation with the scaled rear wing, we got .36 lbf (163 grams) of downforce. Which led to a 91.67% accuracy to simulation, which was almost exact to the numbers ran from last year.
SidePods
The side pods house the radiator and exhaust fans, meaning they are essential for cooling. Additionally, they have to designed as tightly as possible to reduce unwanted drag effects.
Design
Similar to the rear wing, I am the lead designer for the side pods. However there is no previous designs to go off of since this is the first time the team has had side pods since our first competition car: TREV 2.
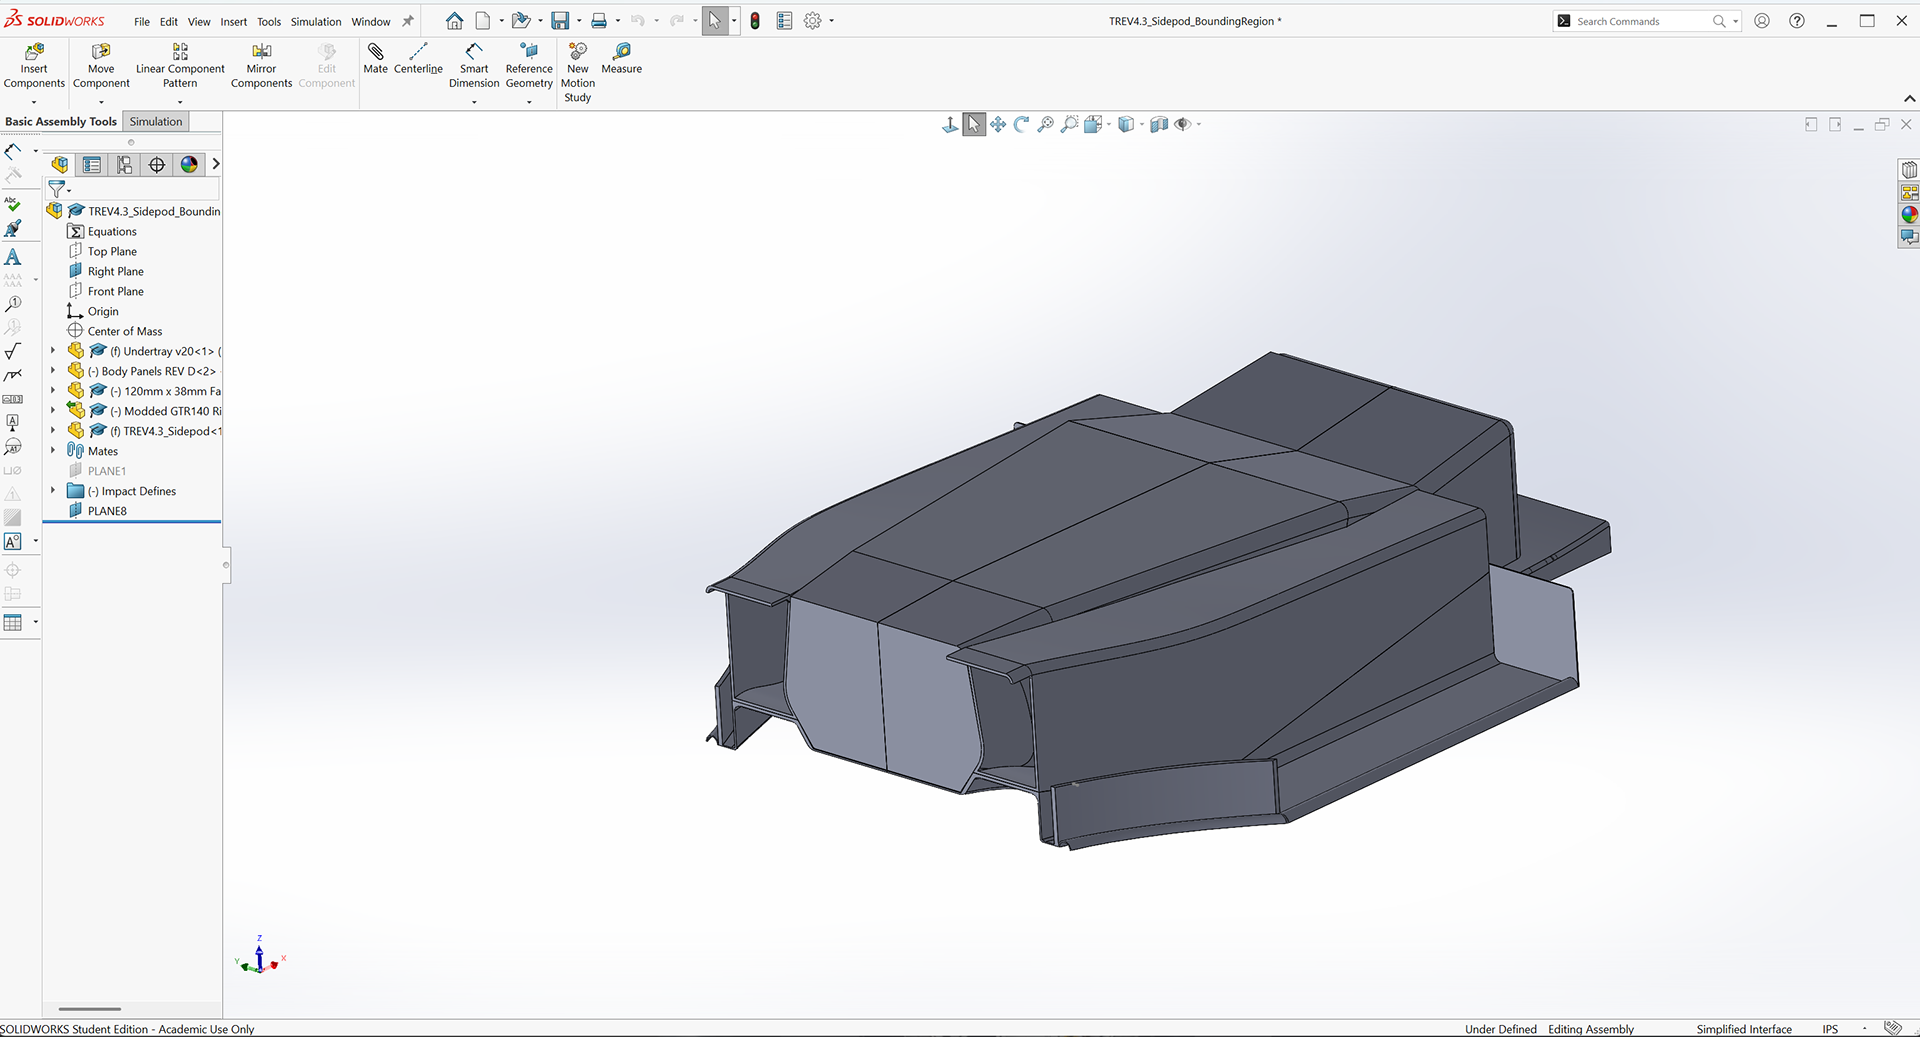
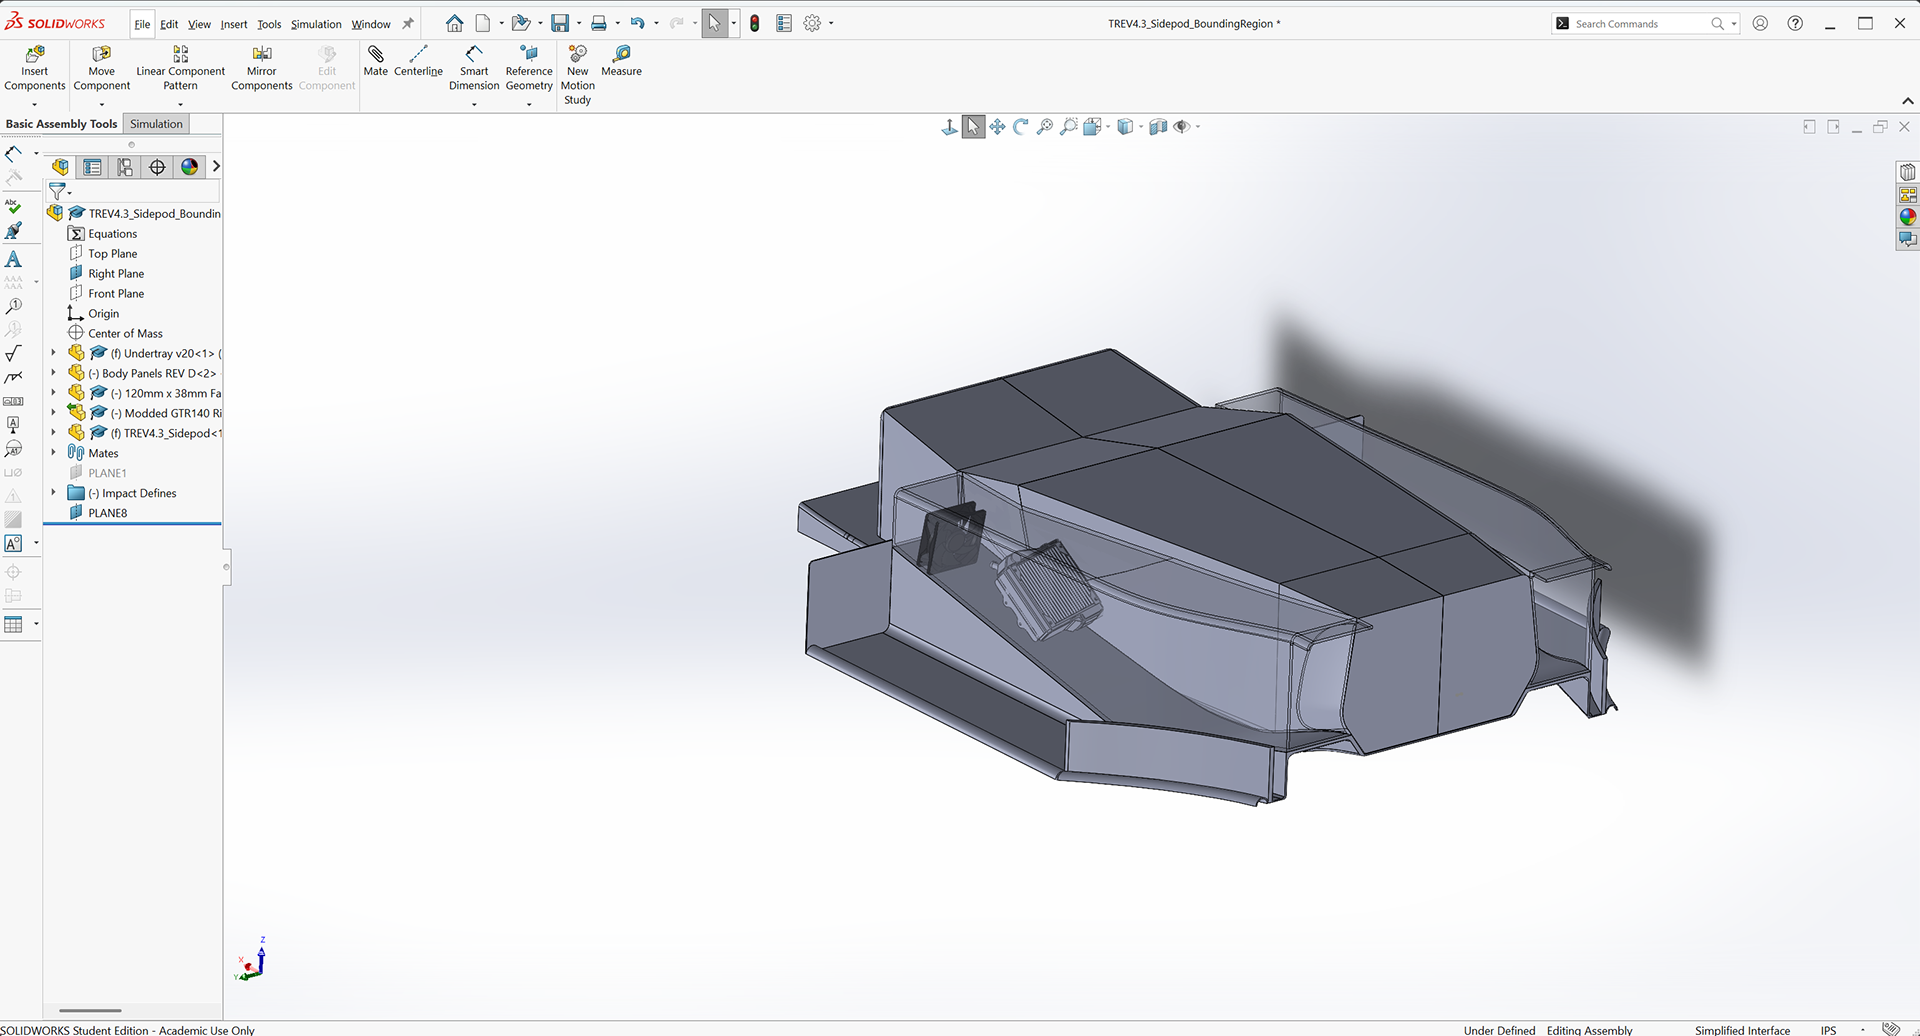
Isometric View of Side Pods
This is the side pod attached to the latest iteration of body panels. The view serves to illustrate what the side pod is bounded against, which is the under tray and the body panels.
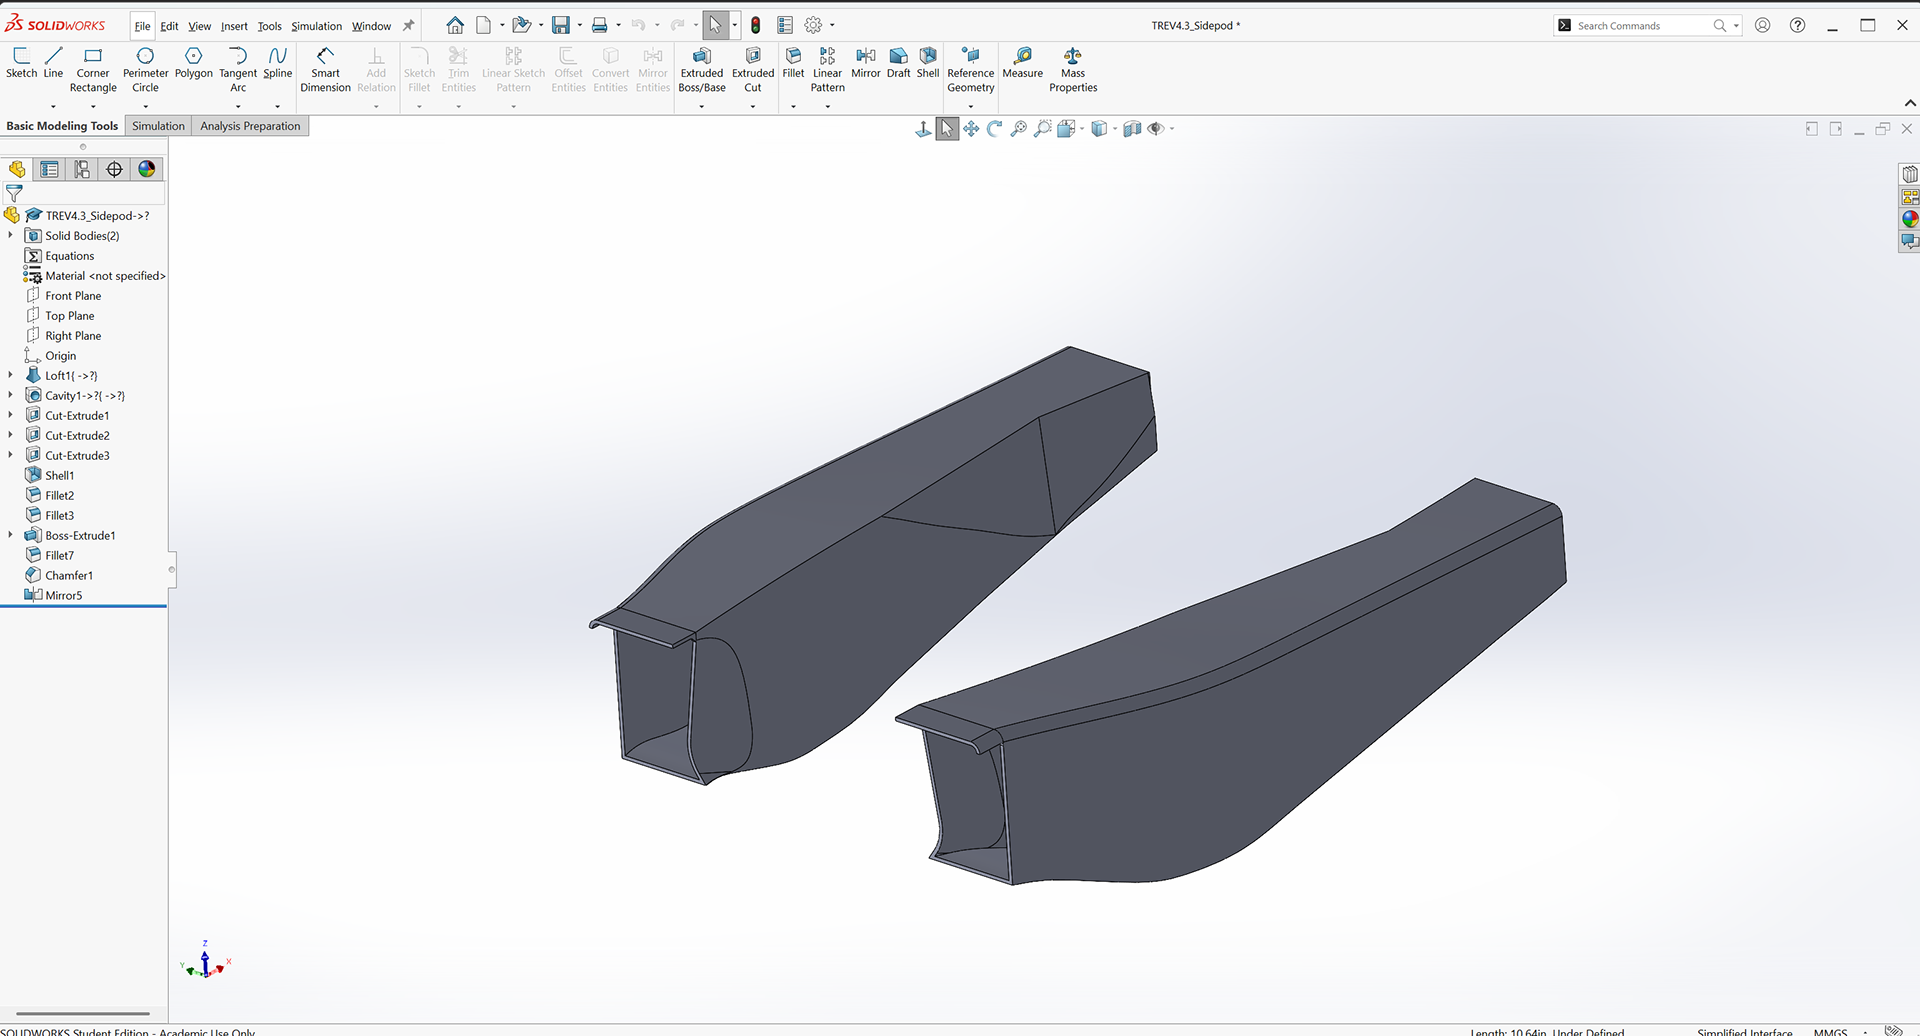
Isometric View of Side Pod Assembly
This isometric image shows just the side pods. The side pods feature a covering duct to channel oncoming air flow from the front of the car through the radiator and the exhaust fan. Additionally, there is a 2 inch overhang which serves to mitigate flow separation from tire wake.
Isometric View of Side Pod Packaging
The side pod in this image is transparent to showcase the custom made radiator and exhaust fan that needs to be properly packaged. The side pod is also shown to follow the side inlet of the under tray. Additionally the radiator will be set at an angle, which allows the profile of the side pod to be smaller than usual.
Simulations
The simulations ran in Siemens Star CCM+ allows for me to see how the side pod channels airflow into the radiator . This is crucial since the radiator getting proper airflow is allows the car to run for an extended period of time.
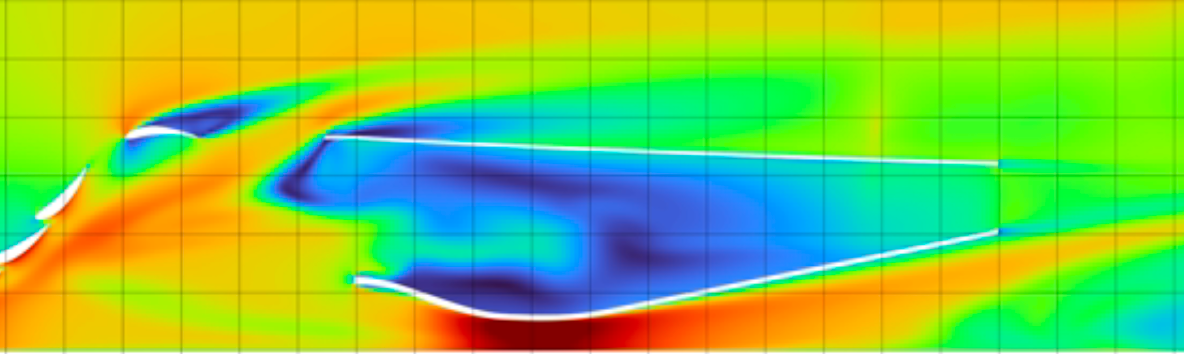
Side Pod Y Axis Velocity Plot
This image of a slice of the side pod was taken in a y axis velocity plot. The image shows how much the air slows down before it speeds back up through the exhaust. Additionally we can see a slow vortex forming on the upper surface which is not ideal and will be fixed on upcoming iterations. However, much of the flow comes from the tire wake which is very turbulent, so mitigating slow moving air is a top priority.
Next Car Testing
The purpose of this section is to document the testing done on the previous car: TREV 3 in order to identify key area of improvement for our next car. This section will showcase wind tunnel testing and carbon panel testing.
Wind Tunnel Testing
Ford Wind Tunnel Testing
The aerodynamics subteam at Terps Racing EV went to Detroit Michigan to test TREV 3 at one of Ford's Wind Tunnels. This test was to see how our aerodynamic package reacts to different velocities. The video shows our test at 96 kph or just under 60 mph. We saw shaking and mild distortion among our manufactured carbon components, which means we need to build them more rigidly.
Smoke Flow Visualization
In this video at Ford's wind tunnel facility we were using smoke flow to visualize the vortexes coming off our front wing and the front left tire. This is an important area for side pods since it shows a bunch of stagnant flow around ( which was also seen in the simulation ).
Carbon Testing
Three Point Bend Test at Naval Academy
This was a three point bend test for our body panels on TREV 4. We tested several panels with varying levels of resin and different thicknesses of coremat at the Naval Academy's Stress Testing Lab. This was done since our body panels in our previous car were getting too thin in certain places. This test showed us that the recipe for panel #3 gave us the best results for strength and weight.
Resin Infusion Testing
This was a resin infusion test, which allows the resin to penetrate more deeply and evenly into more complex molds. This test was done in preparation for our nose cone and seat for our upcoming car. The same steps for setting a motel sheet, vacuum bag, gummy tape, and vacuum are all the same however the difference is an infusion tube which allows resin to be dispersed through the mold. The only issue with this is the set up is slightly tricky and this test was only semi- successful.
Supplemental Videos
TREV 3 is Terps Racing Electric Vehicle's first working race car. This video showcases our mock acceleration run through some leaves.